An attempt to analyze the claims put forward by consistent hashing.
A visualization of the hashring and the key distribution among nodes is presented.
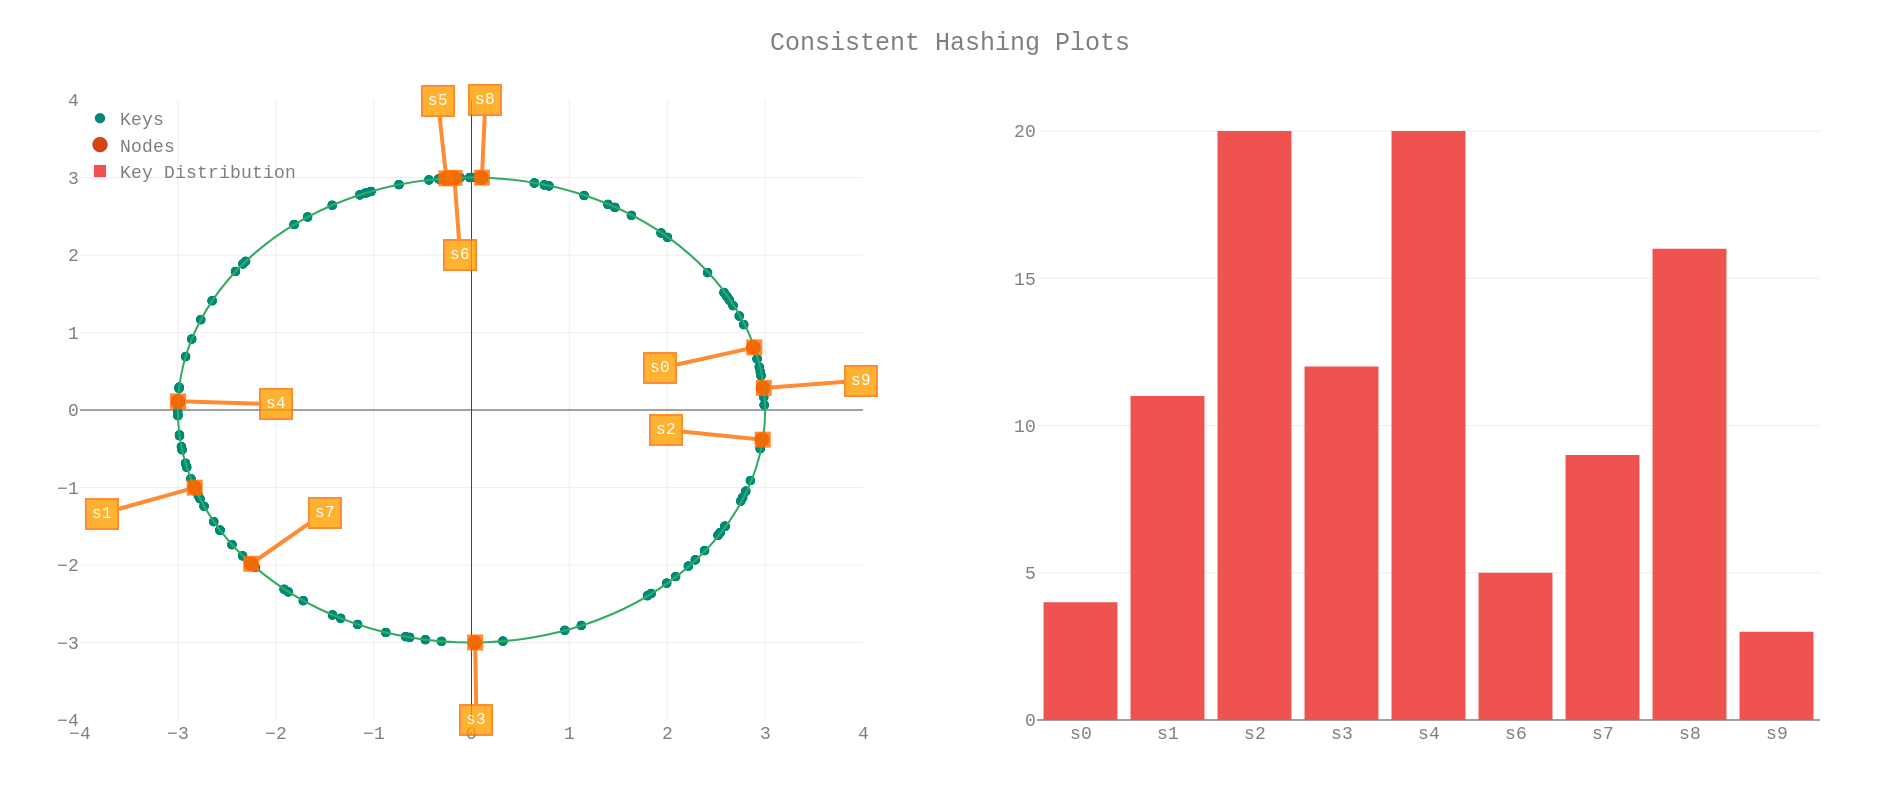
| Parameter | Value |
|---|---|
| Node Count | 3 |
| Key Count | 500 |
| Node Weight | 10 |
The plot describes a simple simulation with the above initial parameters. 5 nodes are added, 3 nodes a removed, 2 nodes are added and then finally 3 nodes are removed.
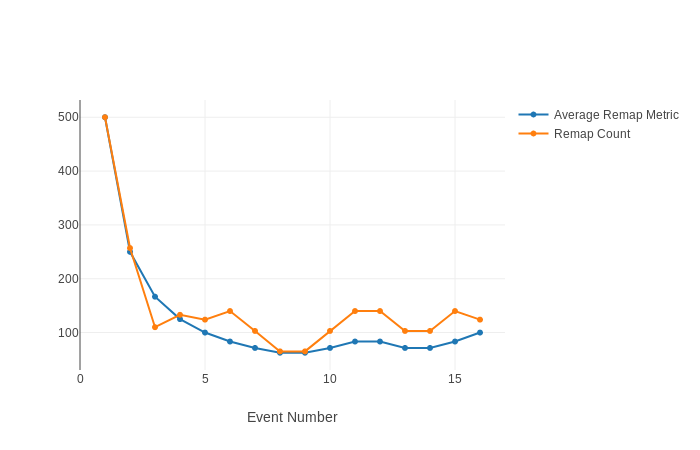
We can observe that the number of keys remapped hovers around the average remap metric i.e. K/N where K is the number of keys and N is the number of nodes.