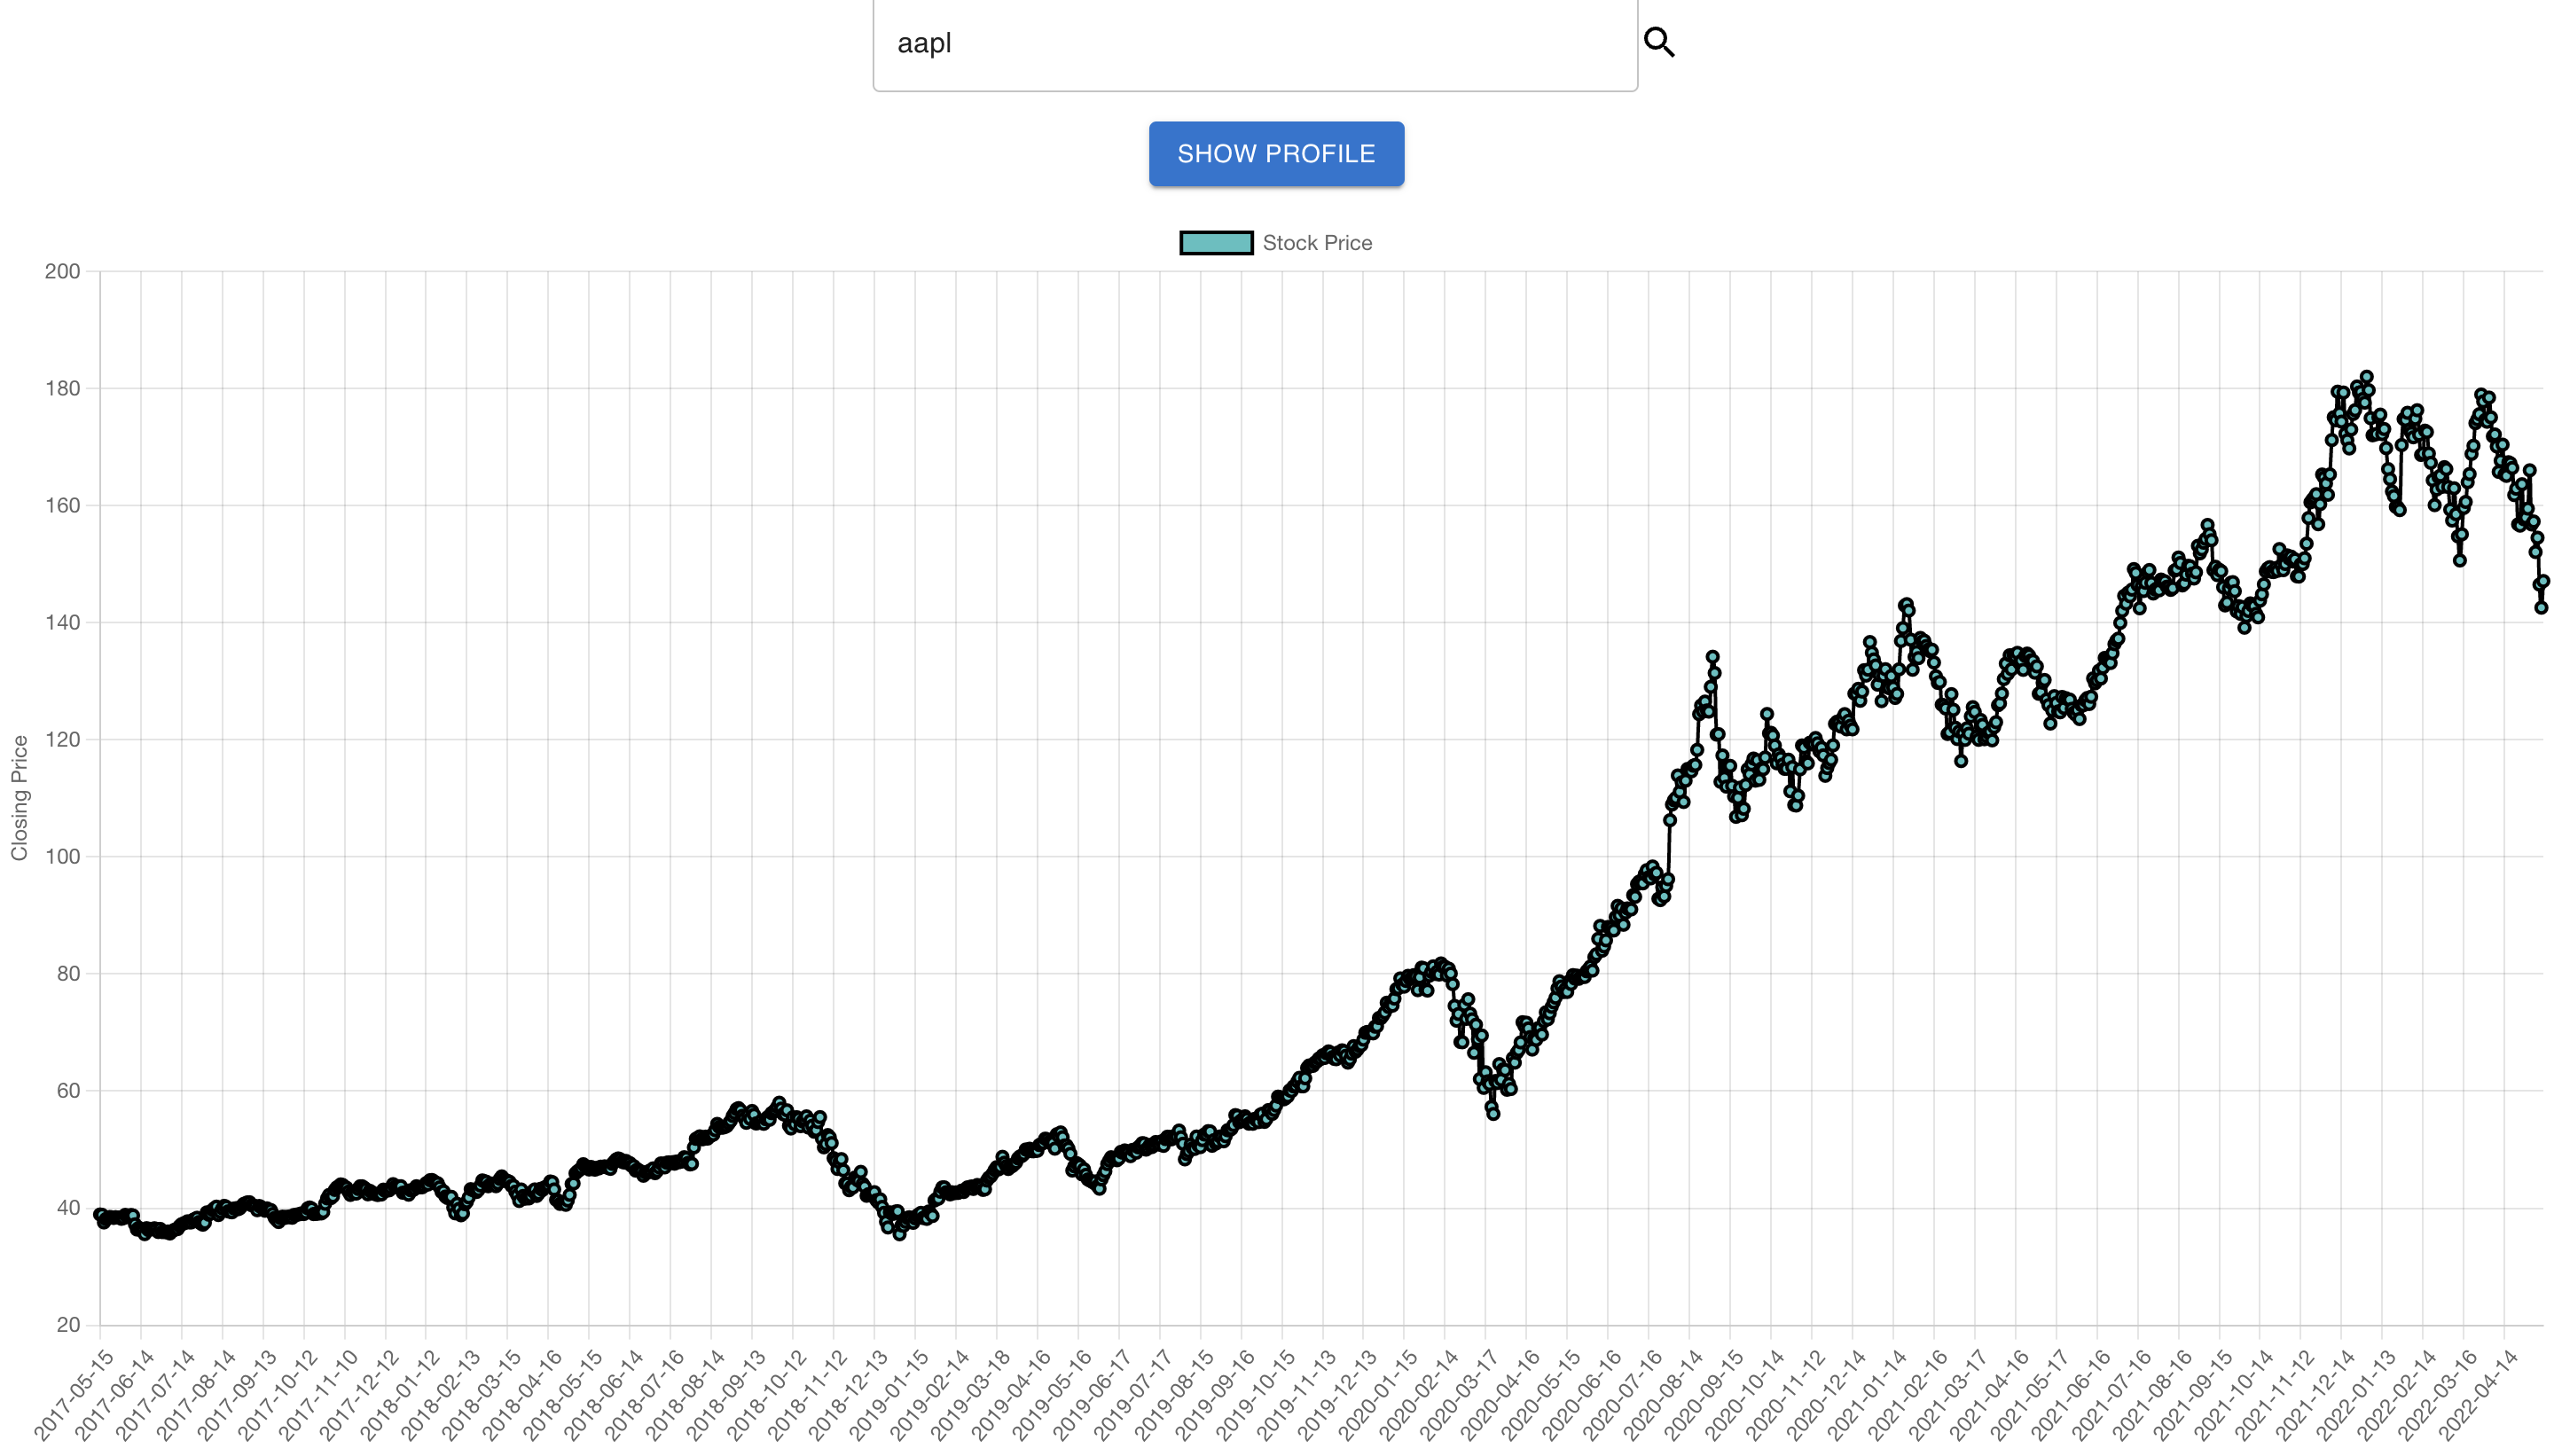
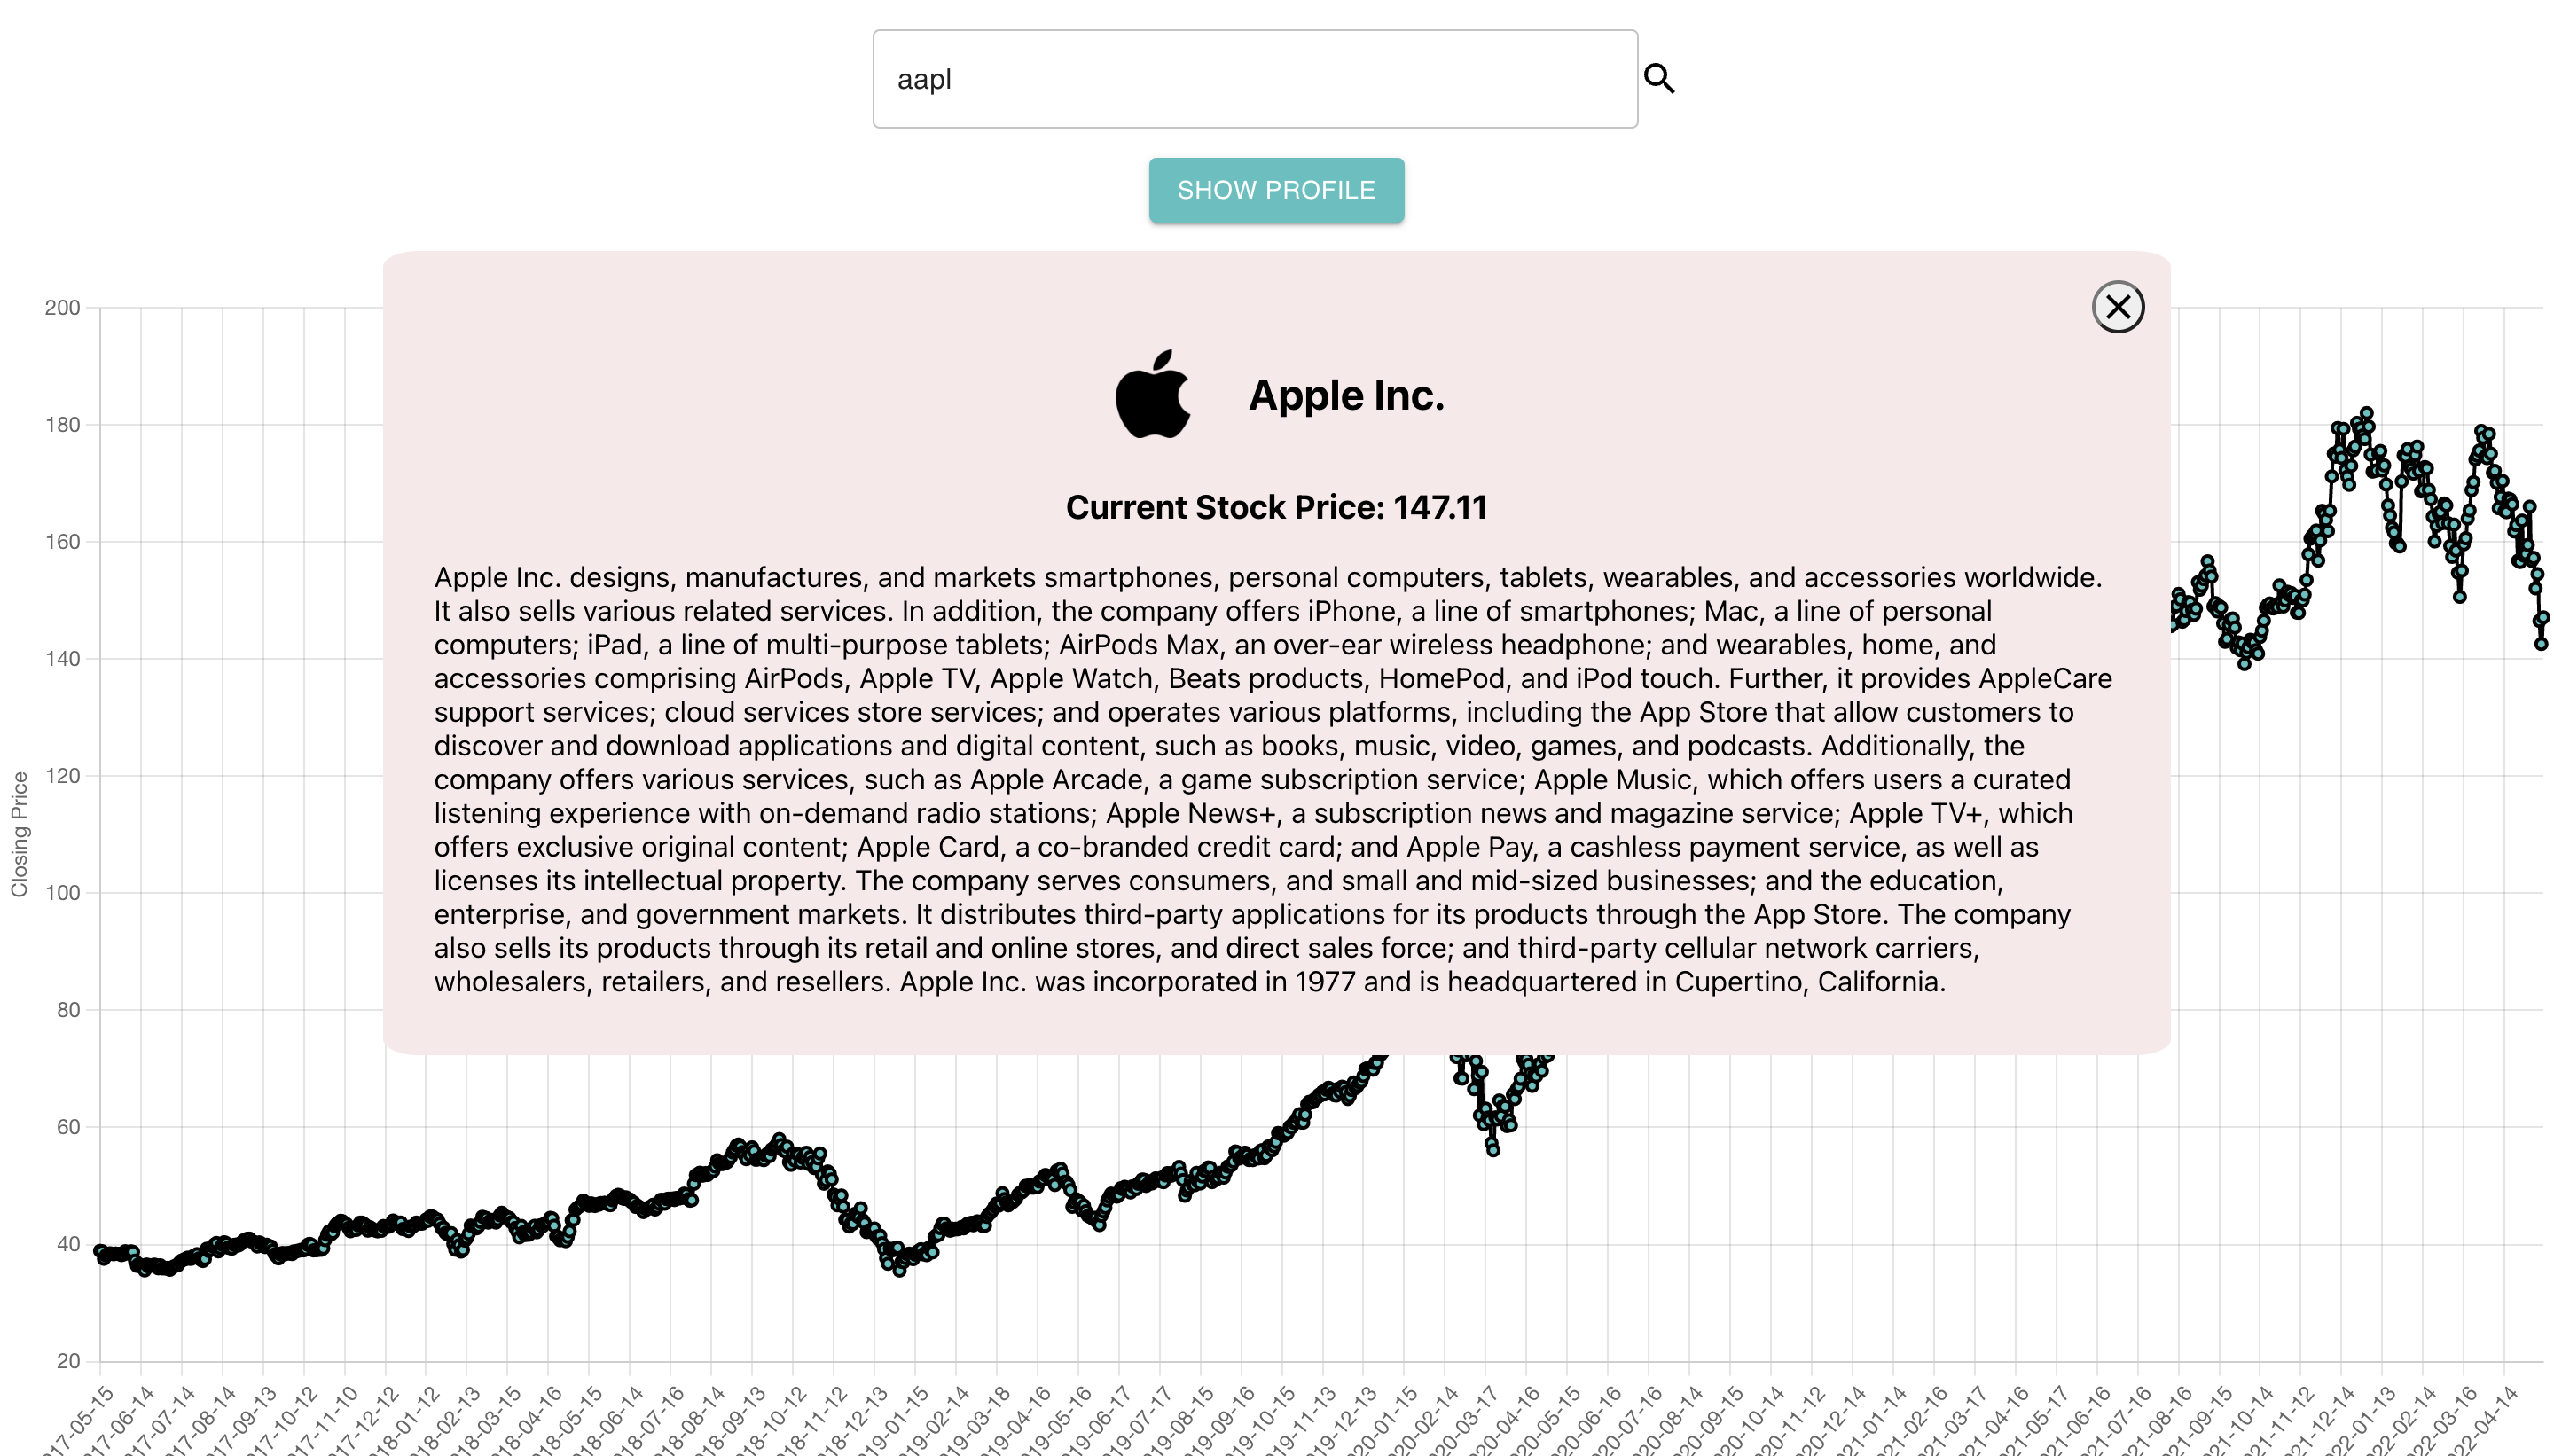
Web application that allows you to visualize the historical prices of your chosen stock; as well as information about your stock's company.
- React, Chart.js, Axios
- Jest, MaterialUI
I was inspired to make this project after seeing my stocks decline in price these past few months :(.
To find an API to use, I searched for free stock APIs. I decided to use Financial Modelling Prep's API that returns company information and historical prices. I retrieved the data with an async/await Axios function and implemented it into a profile modal and Chart.js graph.
Moreover, I wanted to learn how to use Jest with this project. As a result, I created a couple unit tests for each component; increasing the code coverage by 50%.
https://get-to-know-your-stocks.herokuapp.com/