Kwirth is the final implementation of the idea of having a simple way to be able to recieve live-streaming data form your kubernetes clusters. Maybe you feel comfortable with your DataDog or your Grafana and the Loki and the Promtrail, or any other observability tool for monitoring tour kubernetes. But maybe these (and other tools) are too complex for you.
If this is the case, Kwirth is what you need.
Yo can go to Kwirth site if you prefer a user-friendly (non-developer) web interface here for reading Kwirth docs.
Basically, Kwirth receives live streams of data that comes from one or more Kubernetes clusters in real-time, and with the data received you can do several thinks depending on your role and your needs.
- Kwirth can be used on Operations areas for detecting exceptional situations (alerts).
- It can also be used by development teams for reviewing logs of the services deployed to the cluster.
- A Security team (a SOC) can also configure alerts on messages received from the source logs.
- You can analyze your kubernetes objects performance and resource usage (CPU%, Memory%, bandwith usage, latencies, filesystem access...)
And, specially...:
- You can aggregate all this kind of information form different sources. I mean, for example, you can have on unique live-stream log that consolidates logging information from different sources, i.e., difeferent containers, different pods, different namespaces or even different clusters.
Yes, one only command, just a simple 'kubectl' is enough for deploying Kwirth to your cluster.
kubectl apply -f https://raw.githubusercontent.com/jfvilas/kwirth/master/test/kwirth.yamlIf everything is ok, in no more than 8 to 10 seconds Kwirth should be up and running. So next step is accessing the front application of your fresh new logging system. You can access Kwirth via your Kubernetes management tool, via kubectl-port-forwarding, or even creating an ingress (which is the best way). By default, Kwirth listens on root path at port 3883.
If you have created a port forward by entering...
kubectl port-forward svc/kwirth-svc 3883...you should be able to access Kwirth at http://localhost:3883/.
When you first deploy Kwirth there will exist an admin account. The credentials for the admin account are strong credentials like these:
- User:
admin - Password:
password
Enjoy!!
Kwirth is not Loki nor Grafana, Kwirth is not Elastic, Kwirth is not DataDog, Kwirth is not Azure Log Analytics... Kwirth can perform as much as all of the tasks you can do with these observability tools, but with a fraction of the cost (in terms of money, but also in terms of time and kubernetes resource usage).
Kwirth just shows the right kubernetes information to the user that needs it. In addition, Kwirth sends data in real time, live.streaming all the information the users request.
It is important to understand that Kwirth does not store any logging, metrics or whatever information, it is just a kubernetes data exporting system and analyse tool.
The architecture of Kwirth is the one depicted below.
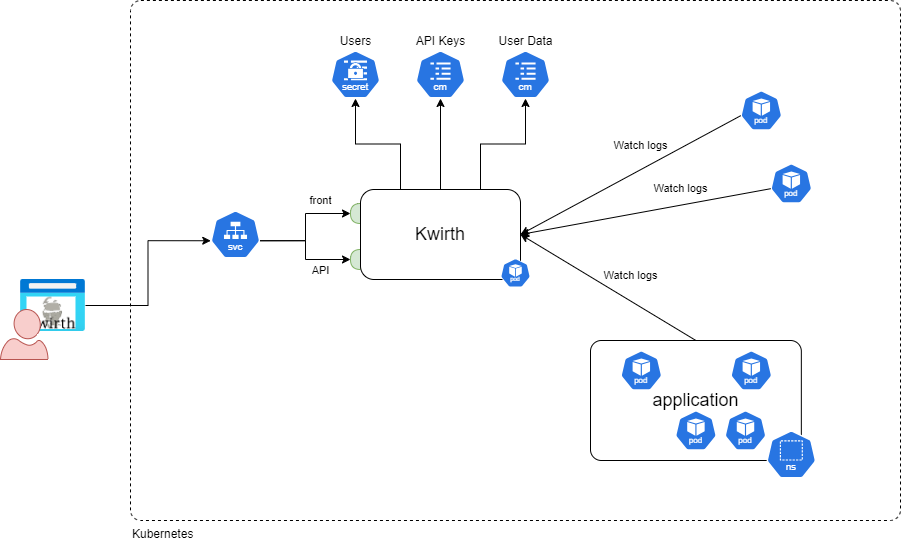
There is only one pod with one only container needed to run Kwirth. Of course, you can create replicas and services and ingresses if you need to scale out, but, generally speaking, Kwirth has no computing needs, since the only function of the pod is extracting kubernetes data and re-sending it to Kwirth clients, wherever it be Kwirth frontend application or any other client like (Backstage Kubelog)[https://www.npmjs.com/package/@jfvilas/plugin-kubelog] or (KwirthLog plugin for Backstage)[https://www.npmjs.com/package/@jfvilas/plugin-kwirth-log].