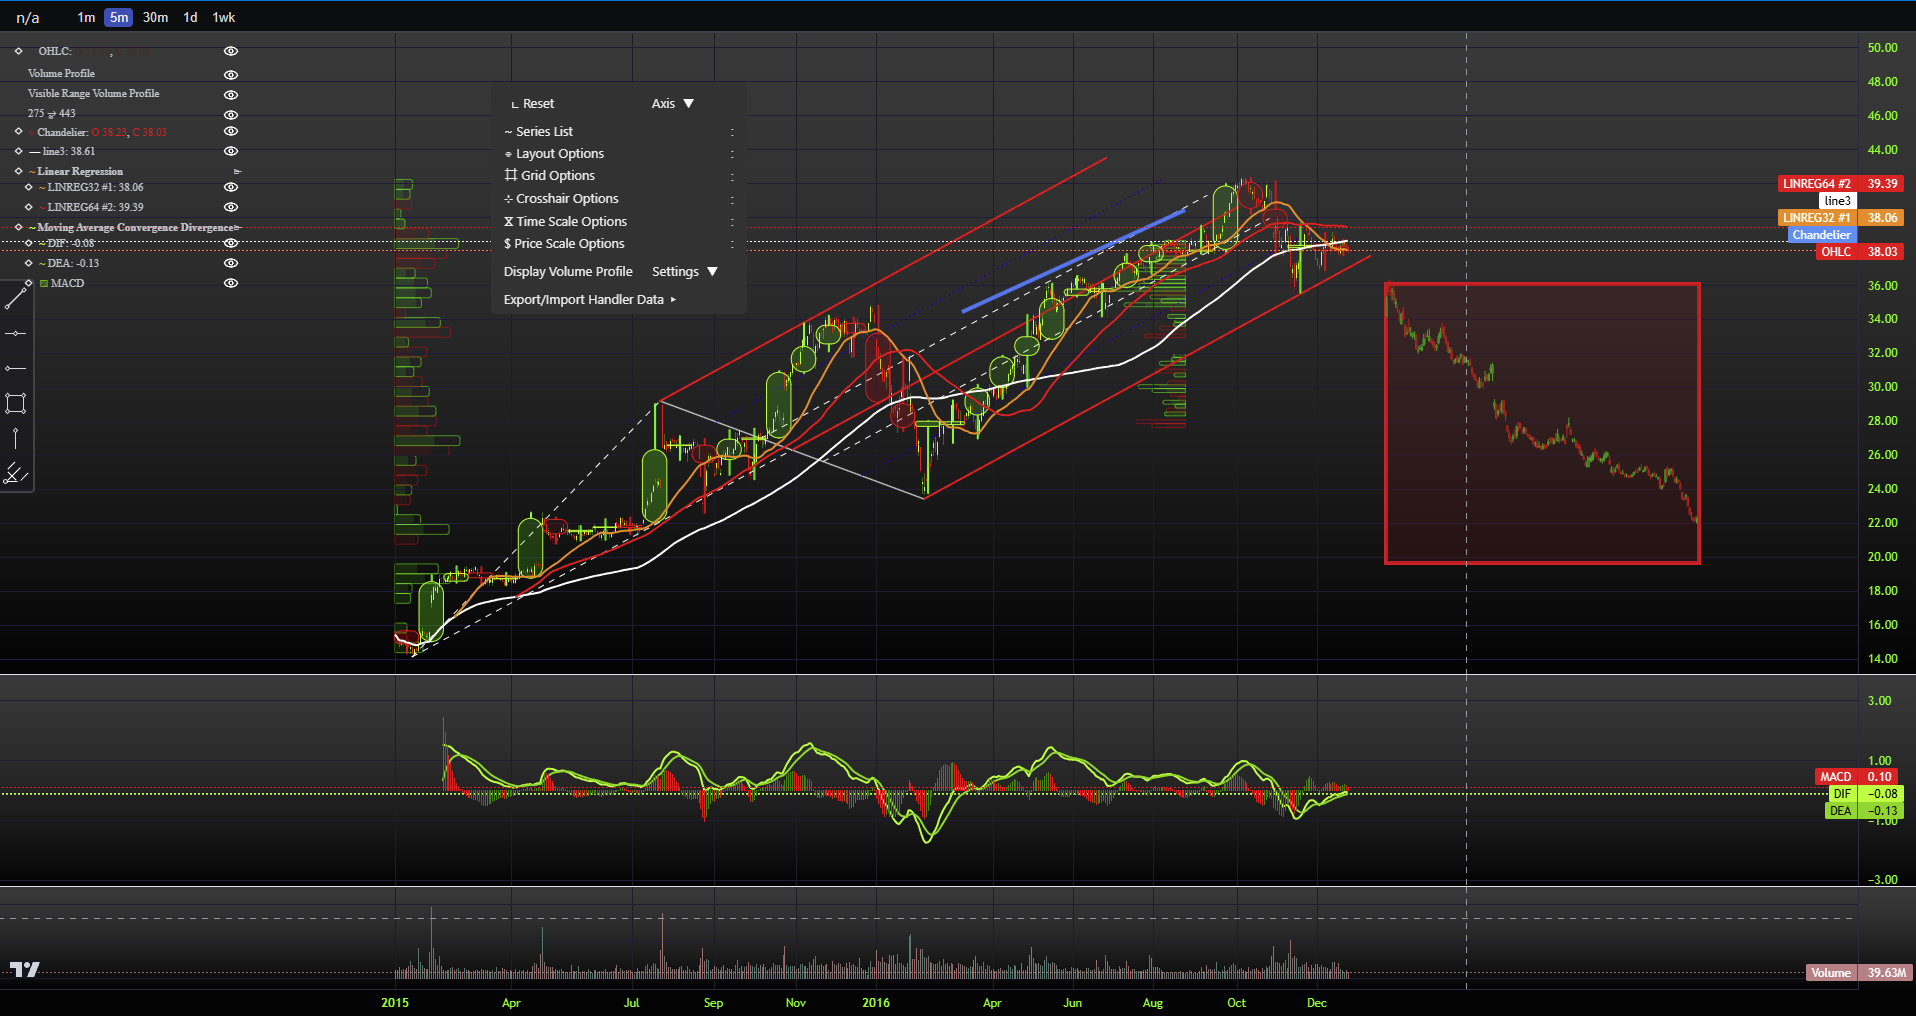
# lightweight-charts-python
pip install lightweight-charts-esistjosh


## Installation
pip install lightweight-charts-esistjosh
## Forked to Add Features
### PineTS integration (original PineTS source: https://github.com/alaa-eddine/PineTS, edited source: https://github.com/EsIstJosh/PineTS)
### PineTS related code is licensed seperately using the AGPL3.0 license: [AGPL License](./AGPL_LICENSE)
Simple scripting capabilities similar to pinescript,
see the [PineTS ReadMe](https://github.com/EsIstJosh/PineTS/blob/bd79b7f2d21d15f7470da118eab4f71638ce07da/README.md)
for more information

### Series Types
- Area
- Bar
- Custom Candlestick implementation
| | |
V V V
- Capable of candle data aggregation
for displaying multiple timeframes
simultaneously
- Customizable Line Width
- Customizable Line Style
- Customizable Bar Spacing
- Customizable Shape:
- Rectangle
- Rounded
- Ellipse
- Arrow
- Polygon
- Bar
- 3d
- Volume Color Opacity
### Plugins
- Fill Area: Shades the area between two series.
- Pitch Fork: Tool for drawing (added to toolbox):
- Standard
- Schiff
- Modified Schiff
- Inside
- Volume Profile: Displays volume profiles based on the visible range and supports drawing.
- Trend Trace: A transformable/scalable replica of a section of series between a drawings points. Similar to 'Bars Pattern' in TradingView (instantiated from and linked to existing drawing: box, trendline etc)
### Indicators (implemented in typescript, from KLineChart primarily ( https://github.com/klinecharts/KLineChart ))
Overlay Indicators:
- Arnaud Legoux Moving Average
- Bollinger Bands
- Exponential Moving Average
- Highest High
- Highest High Lowest Low
- Linear Regression Indicator
- Lowest Low
- Median
- Moving Average
- Rolling Moving Average
- Simple Moving Average
- Stop and Reverse
- Super Trend
- Symmetric Weighted Moving Average
- Triple Exponentially Smoothed Average
- Volume Weighted Average Price
- Volume Weighted Moving Average
- Weighted Moving Average
Oscillator Indicators:
- Awesome Oscillator
- Average True Range
- Bias
- BRAR
- Bull and Bear Index
- Commodity Channel Index
- Current Ratio
- Difference of Moving Average
- Directional Movement Index
- Momentum
- Moving Average Convergence Divergence
- Psychological Line
- Rate of Change
- Relative Strength Index
- Stochastic Oscillator
- Variance
- Williams %R
- Change
- Range
- Standard Deviation
### Context Menu
- Upgraded context menu for better control over chart/series/primitive settings.
- Ability to save options for chart, series, and primitives to JSON.
### Legend
- Upgraded to allow for collapsible grouping of series.
- Tree-style display of groups > series > primitives.
### Series Cloning / Type Conversion
- Simple cloning to different series types
## License
Unless otherwise stated, all code in this repository is licensed under the MIT License.
Additional license: See the [AGPL License](./AGPL_LICENSE) for specific components covered under AGPL.
For full details, refer to the [MIT License](./MIT_LICENSE).
---####################################################################################---
## Original
[](https://pypi.org/project/lightweight-charts/)
[](https://python.org "Go to Python homepage")
[](https://lightweight-charts-python.readthedocs.io/en/latest/index.html)
**lightweight-charts-python** aims to provide a simple and Pythonic way to access and implement [TradingView's Lightweight Charts](https://www.tradingview.com/lightweight-charts/).
---
## Installation
```bash
pip install lightweight-charts-esistjosh
## Installation
pip install lightweight-charts-esistjosh
___

## Features
1. Streamlined for live data, with methods for updating directly from tick data.
2. Multi-pane charts using [Subcharts](https://lightweight-charts-python.readthedocs.io/en/latest/reference/abstract_chart.html#AbstractChart.create_subchart).
3. The [Toolbox](https://lightweight-charts-python.readthedocs.io/en/latest/reference/toolbox.html), allowing for trendlines, rectangles, rays and horizontal lines to be drawn directly onto charts.
4. [Events](https://lightweight-charts-python.readthedocs.io/en/latest/tutorials/events.html) allowing for timeframe selectors (1min, 5min, 30min etc.), searching, hotkeys, and more.
5. [Tables](https://lightweight-charts-python.readthedocs.io/en/latest/reference/tables.html) for watchlists, order entry, and trade management.
6. Direct integration of market data through [Polygon.io's](https://polygon.io/?utm_source=affiliate&utm_campaign=pythonlwcharts) market data API.

__Supports:__ Jupyter Notebooks, PyQt6, PyQt5, PySide6, wxPython, Streamlit, and asyncio.

PartTimeLarry: [Interactive Brokers API and TradingView Charts in Python](https://www.youtube.com/watch?v=TlhDI3PforA)
___

### 1. Display data from a csv:

```python
import pandas as pd
from lightweight_charts import Chart


if __name__ == '__main__':

    chart = Chart()

    # Columns: time | open | high | low | close | volume
    df = pd.read_csv('ohlcv.csv')
    chart.set(df)

    chart.show(block=True)

import pandas as pd
from time import sleep
from lightweight_charts import Chart

if __name__ == '__main__':

    chart = Chart()

    df1 = pd.read_csv('ohlcv.csv')
    df2 = pd.read_csv('next_ohlcv.csv')

    chart.set(df1)

    chart.show()

    last_close = df1.iloc[-1]['close']

    for i, series in df2.iterrows():
        chart.update(series)

        if series['close'] > 20 and last_close < 20:
            chart.marker(text='The price crossed $20!')

        last_close = series['close']
        sleep(0.1)
import pandas as pd
from time import sleep
from lightweight_charts import Chart


if __name__ == '__main__':

    df1 = pd.read_csv('ohlc.csv')

    # Columns: time | price
    df2 = pd.read_csv('ticks.csv')

    chart = Chart()

    chart.set(df1)

    chart.show()

    for i, tick in df2.iterrows():
        chart.update_from_tick(tick)

        sleep(0.03)
import pandas as pd
from lightweight_charts import Chart


def calculate_sma(df, period: int = 50):
    return pd.DataFrame({
        'time': df['date'],
        f'SMA {period}': df['close'].rolling(window=period).mean()
    }).dropna()


if __name__ == '__main__':
    chart = Chart()
    chart.legend(visible=True)

    df = pd.read_csv('ohlcv.csv')
    chart.set(df)

    line = chart.create_line('SMA 50')
    sma_data = calculate_sma(df, period=50)
    line.set(sma_data)

    chart.show(block=True)
import pandas as pd
from lightweight_charts import Chart


if __name__ == '__main__':

    chart = Chart()

    df = pd.read_csv('ohlcv.csv')

    chart.layout(background_color='#090008', text_color='#FFFFFF', font_size=16,
                 font_family='Helvetica')

    chart.candle_style(up_color='#00ff55', down_color='#ed4807',
                       border_up_color='#FFFFFF', border_down_color='#FFFFFF',
                       wick_up_color='#FFFFFF', wick_down_color='#FFFFFF')

    chart.volume_config(up_color='#00ff55', down_color='#ed4807')

    chart.watermark('1D', color='rgba(180, 180, 240, 0.7)')

    chart.crosshair(mode='normal', vert_color='#FFFFFF', vert_style='dotted',
                    horz_color='#FFFFFF', horz_style='dotted')

    chart.legend(visible=True, font_size=14)

    chart.set(df)

    chart.show(block=True)
import pandas as pd
from lightweight_charts import Chart


def get_bar_data(symbol, timeframe):
    if symbol not in ('AAPL', 'GOOGL', 'TSLA'):
        print(f'No data for "{symbol}"')
        return pd.DataFrame()
    return pd.read_csv(f'bar_data/{symbol}_{timeframe}.csv')


def on_search(chart, searched_string):  # Called when the user searches.
    new_data = get_bar_data(searched_string, chart.topbar['timeframe'].value)
    if new_data.empty:
        return
    chart.topbar['symbol'].set(searched_string)
    chart.set(new_data)


def on_timeframe_selection(chart):  # Called when the user changes the timeframe.
    new_data = get_bar_data(chart.topbar['symbol'].value, chart.topbar['timeframe'].value)
    if new_data.empty:
        return
    chart.set(new_data, True)


def on_horizontal_line_move(chart, line):
    print(f'Horizontal line moved to: {line.price}')


if __name__ == '__main__':
    chart = Chart(toolbox=True)
    chart.legend(True)

    chart.events.search += on_search

    chart.topbar.textbox('symbol', 'TSLA')
    chart.topbar.switcher('timeframe', ('1min', '5min', '30min'), default='5min',
                          func=on_timeframe_selection)

    df = get_bar_data('TSLA', '5min')
    chart.set(df)

    chart.horizontal_line(200, func=on_horizontal_line_move)

    chart.show(block=True)
Inquiries: [email protected]
This package is an independent creation and has not been endorsed, sponsored, or approved by TradingView. The author of this package does not have any official relationship with TradingView, and the package does not represent the views or opinions of TradingView.