Simple command line pomodoro app with visualization of statistics. The Pomodoro technique is a time management technique for improving productivity.
Check https://en.wikipedia.org/wiki/Pomodoro_Technique for more details.
The code is based on: http://code.activestate.com/recipes/577358-pomodoro-timer/
pip install pomodoro-cliOR
    git clone https://github.com/mehdidc/pomodoro
    cd pomodoro
    pip install -r requirements.txt
python setup.py install pomodoro 60 5will run pomodoro cycles of 60mins of work and 5mins of rest. By default an alarm sound will be played at the end of pomodoros. Warning : alarm needs either mpg123 (https://www.mpg123.de/) or ffplay(https://ffmpeg.org/ffplay.html) to be installed.
it can be disabled using:
pomodoro 60 5 --alarm=FalseInstead of an alarm, you might rather want to receive a message box each time you finish a pomodoro. To do that, you can do:
pomodoro 60 5 --notif=True --alarm=FalseWarning : notif needs pyqt5 (https://pypi.python.org/pypi/PyQt5/5.8.2)
Enable display of a command line countdown timer as follows:
pomodoro 60 5 --timer=Trueeach time a pomodoro is performed, its recorded on a small text database in your HOME/.pomodoro. To visualize the statistics of your pomodoros, you can use pomostat. Here are some examples:
  pomostat overall
  pomostat week
  pomostat thisweek
  pomostat lastweek
  pomostat week --weekof='2018-01-01'
  pomostat stats
  pomostat weeks
  pomostat today
  pomostat yesterday
Check pomostat --help for more information.
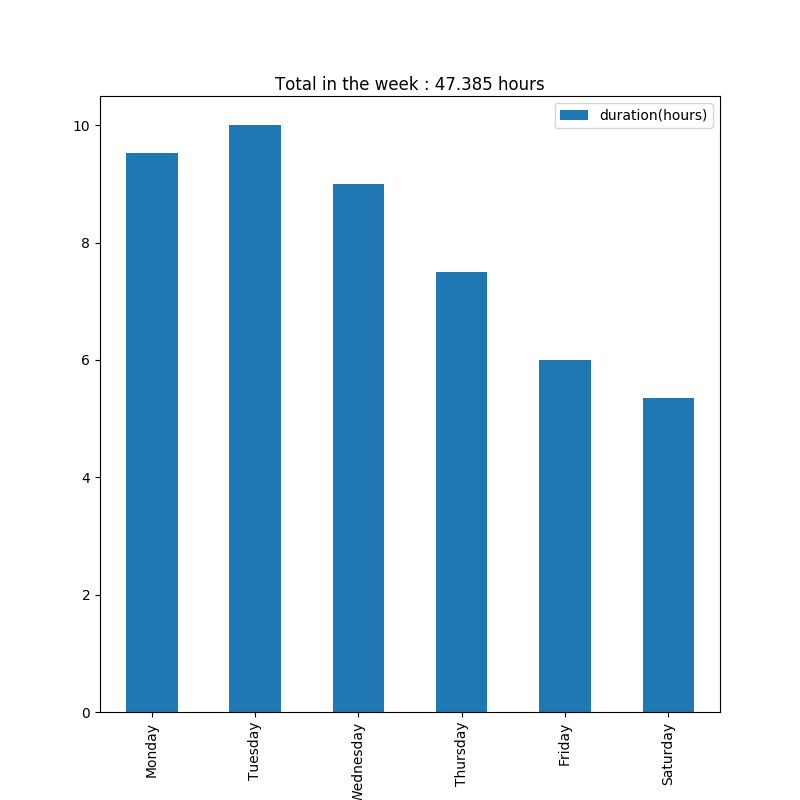
Here is an example of graph with pomostat thisweek: