
Pulls your Github repo data and generates a pie chart showing programming language makeup. Uses Github authentication.
Currently converting from something I used once for myself to a tool others can use
Hosted here currently: http://www.brianboll.com/piechart/piechart.php
- Click the link
- Grant app access through Github (permissions granted explained here):
- You will be redirected back to the app where your pie chart will be generated
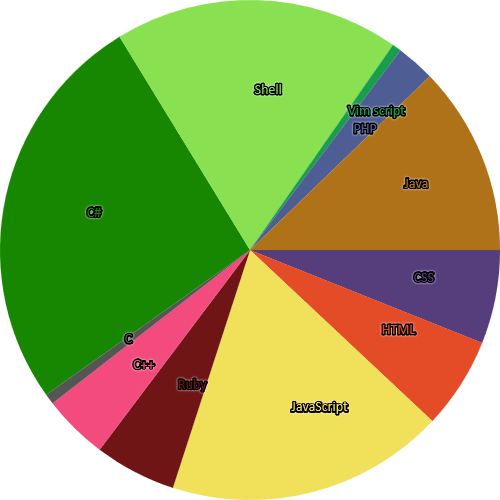
Example of what mine looked like:
Use a library like D3.js for better image resolutions and more options. Build a front-end allowing users to generate their own with different options like font size, show/hide percentages, etc.
From Github docs:
Grants read-only access to public information (includes public user profile info, public repository info, and gists)